Given the influence of neighborhoods on children’s healthy development, it is very important to know where children live in relation to neighborhood opportunity and whether all children have equal access to neighborhood conditions and resources that help them thrive. The Child Opportunity Index allows us to answer these important questions.
To summarize inequities in children’s access to opportunity, we calculate Child Opportunity Score by racial/ethnic group for each metro area. The score for a given racial/ethnic group represents the score of the neighborhood experienced by the typical (median) child of that group.
For example, as the ruler below shows, in the Milwaukee metro the typical White child enjoys a neighborhood with a Child Opportunity Score of 85, while the typical Black child lives in a neighborhood with a score of only 6. As another point of comparison, this racial gap in Milwaukee represents about four opportunity levels (the maximum possible): the typical Black child lives in a very low-opportunity neighborhood, while the typical White child lives in a very high-opportunity neighborhood.
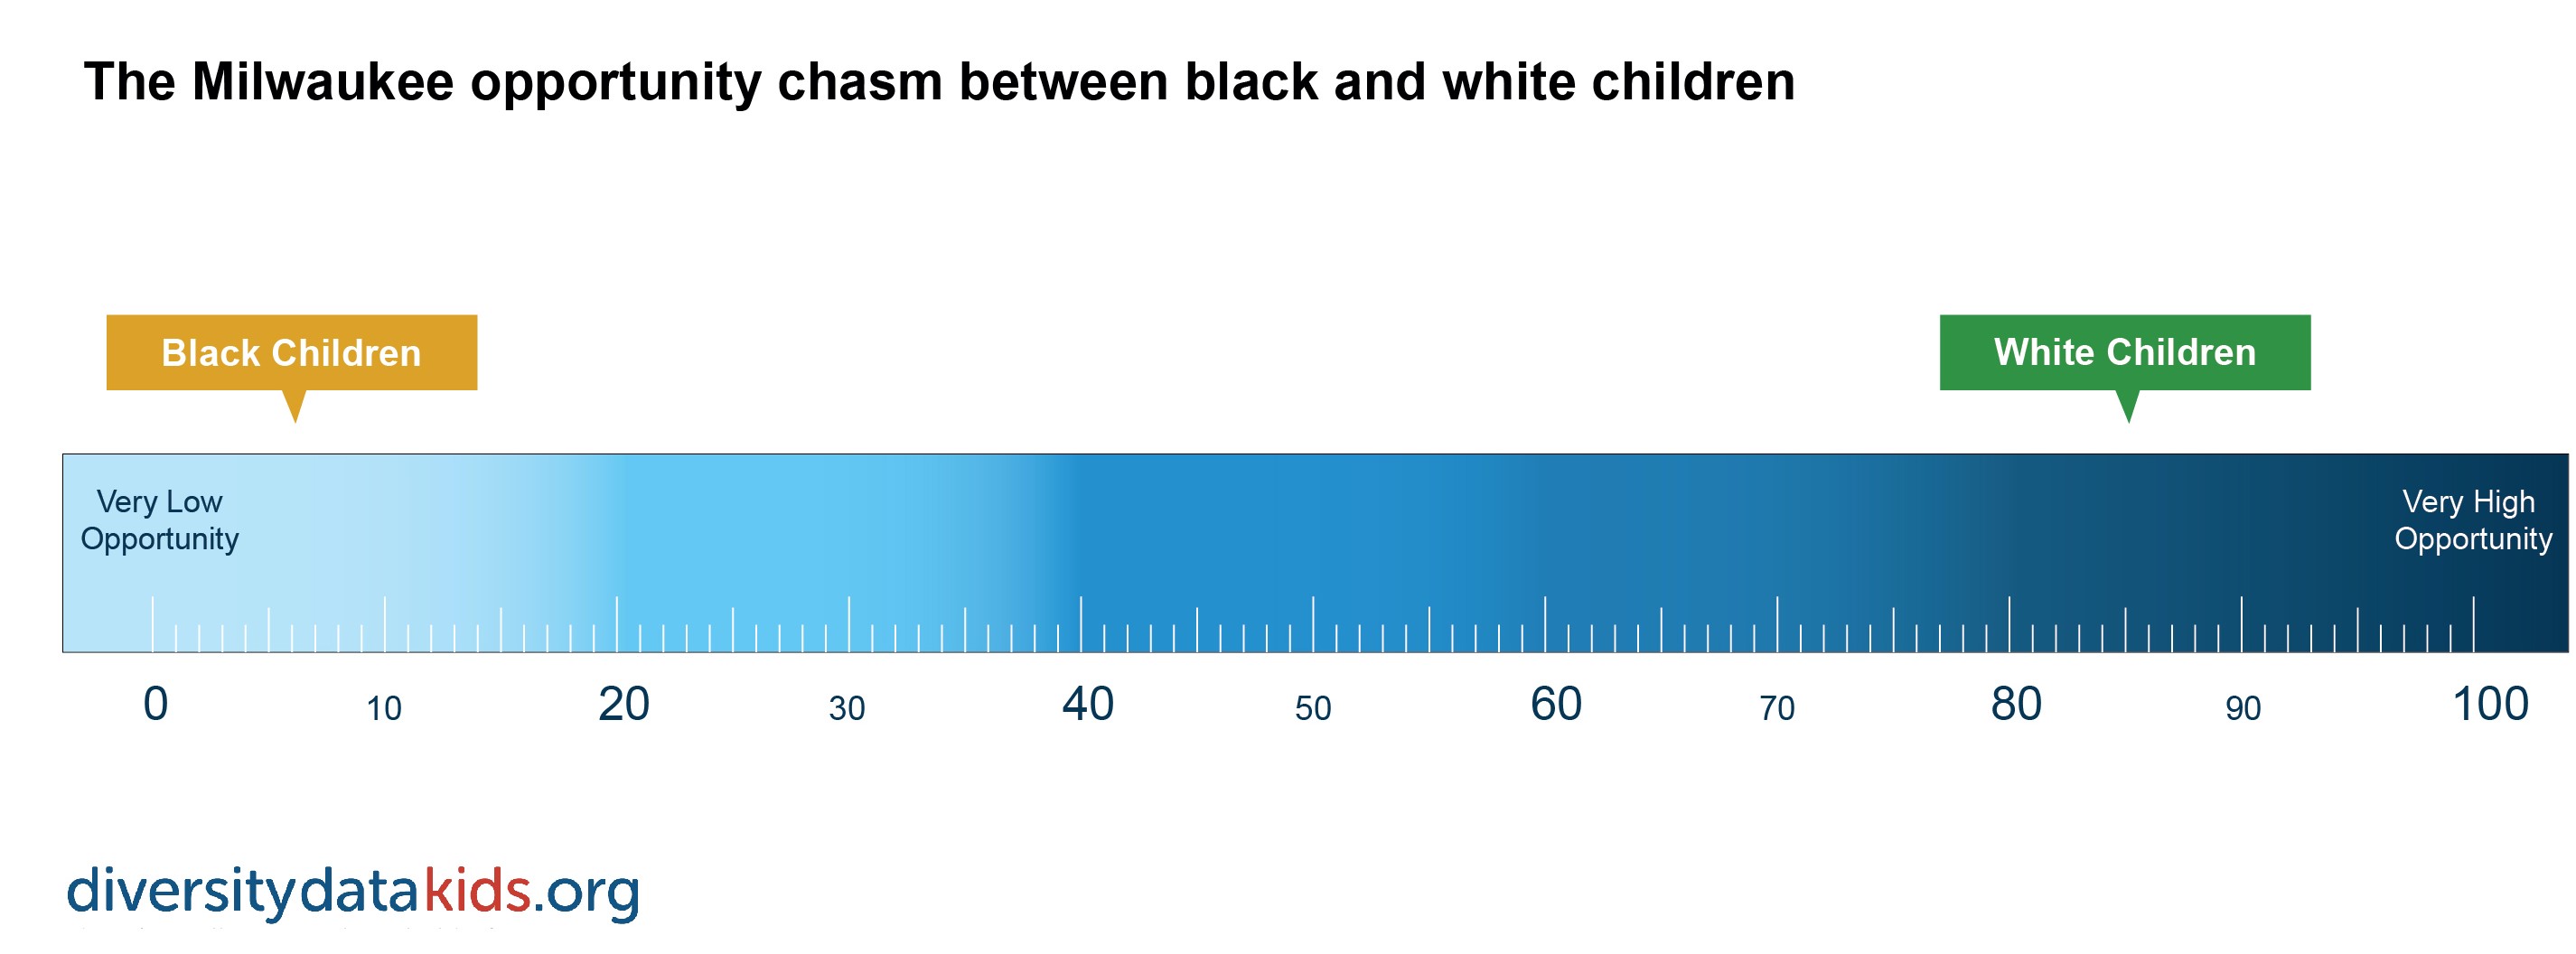
Child Opportunity Scores by race/ethnicity
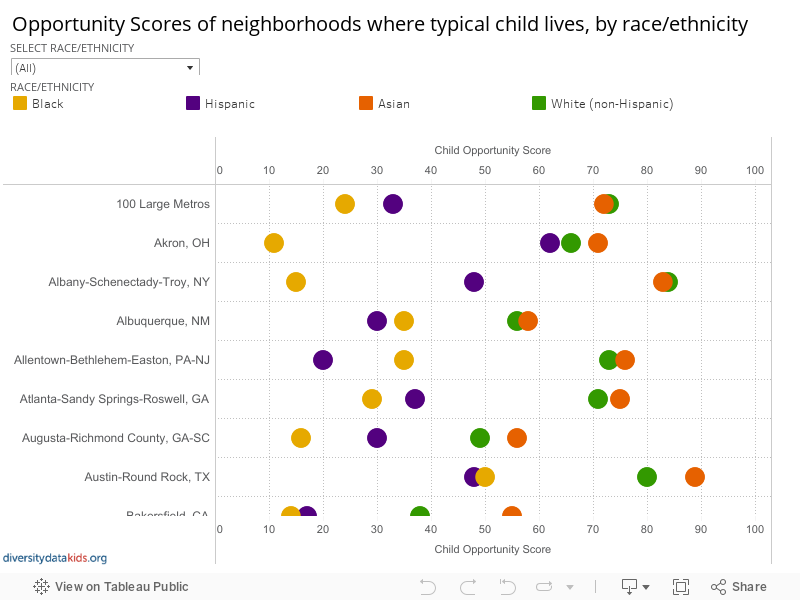
The pattern of inequity in Milwaukee is remarkably consistent across the 100 largest metropolitan areas: Black and Hispanic children live in neighborhoods with much lower Child Opportunity Scores than the neighborhoods of White and Asian children.
The graph below shows Child Opportunity Scores by child race/ethnicity within the 100 largest metro areas. As you scroll down, notice that the gap between the Child Opportunity Score for Black children (yellow dots on the left) and White children (green dots on the right) expands or contracts depending on the metro area, but never disappears. A similar pattern of inequity exists between White and Hispanic children (purple dots on the left). After making your selections, click inside the chart to close the menu.
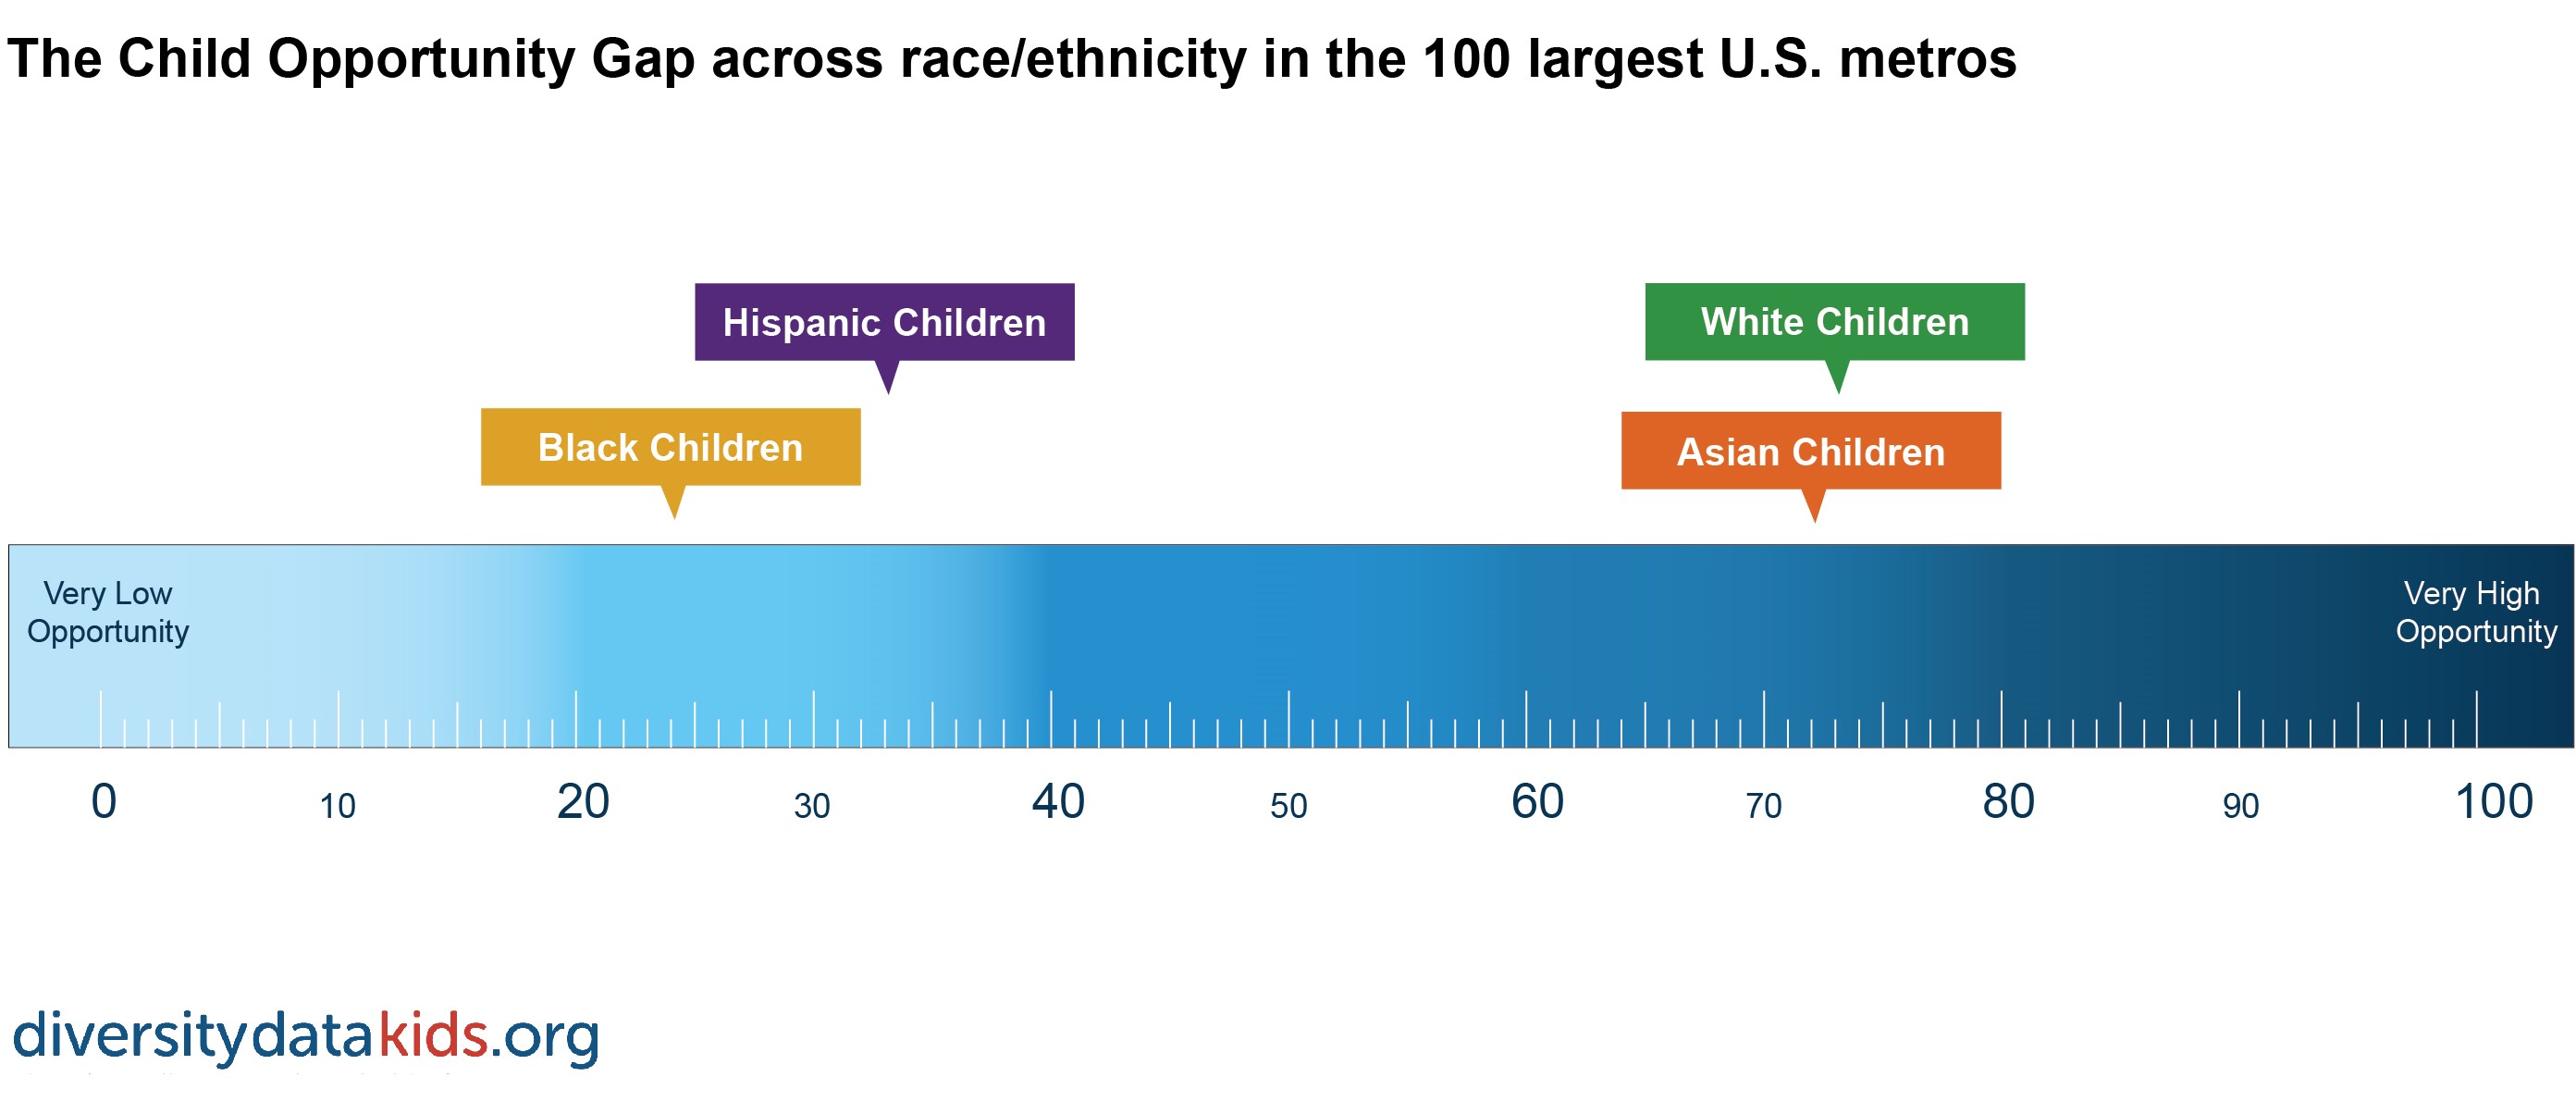
For the 100 largest metro areas combined, the score for White children is 73 compared to 72 for Asian children, 33 for Hispanic children and 24 for Black children. The Child Opportunity Score for White children is more than three times the score for Black children and more than two times the score for Hispanic children.
What if children had equitable access to opportunity in neighborhoods?
If all children, regardless of their race or ethnicity, had equal access to neighborhood opportunity, the Child Opportunity Score for each racial/ethnic group would be similar. If conditions were equitable and we ranked metros according to their Child Opportunity Score (which indicates the overall opportunity for the typical child in that metro), the scores for White, Black, Hispanic and Asian children would all be very similar to the overall score within each metro. The scores for children of any racial or ethnic group would look like the hypothetical example below: the dots would cluster along the 45-degree line.
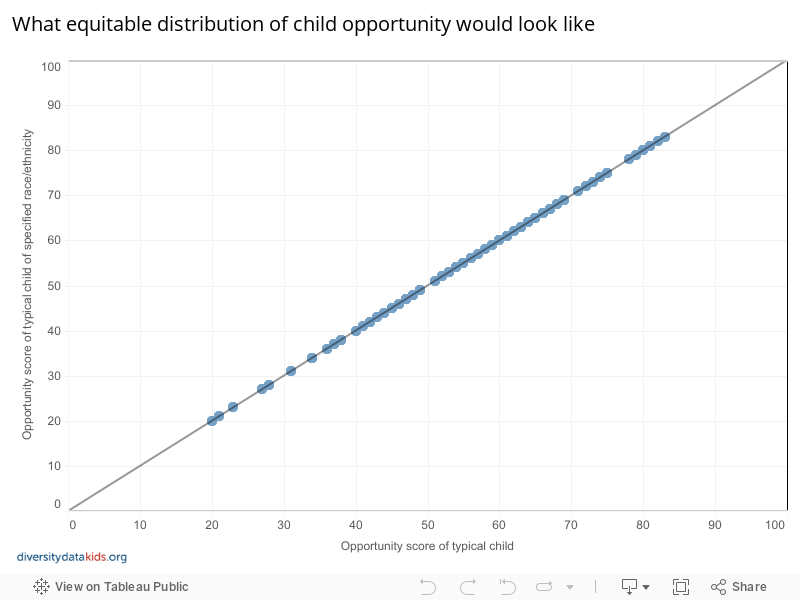
The 45-degree line above represents a hypothetical situation in which in each metro, all children, regardless of their racial/ethnic group, have the same Child Opportunity Score. We had to create this hypothetical situation to illustrate how equity would look because in all the 100 largest metro areas the reality is strikingly different.
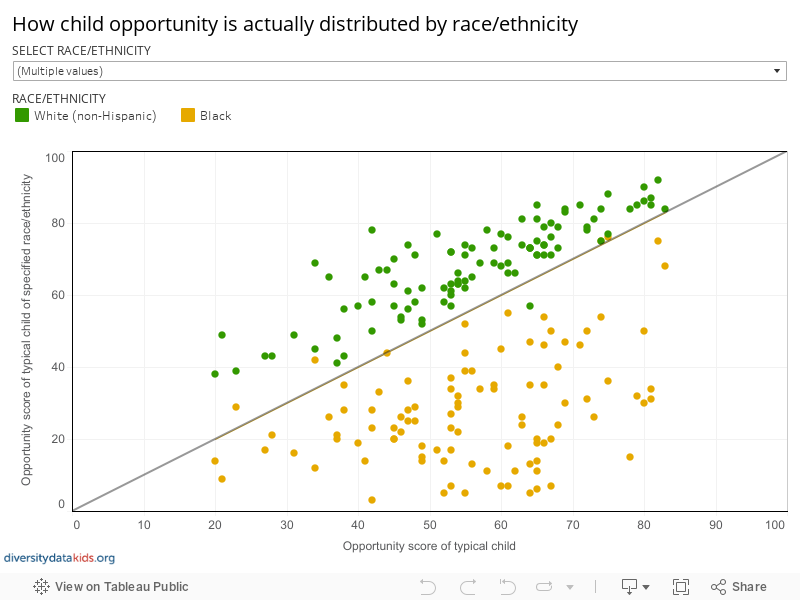
Instead, the graph below shows that child opportunity is starkly divided, with the typical White and Asian/Pacific Islander child in nearly all 100 metros living in neighborhoods with scores above the 45-degree line, which means that the opportunity scores for White and Asian/Pacific Islander children are well above the overall opportunity score in their metro.
On the other hand, in nearly all 100 metros, the typical Hispanic and Black child live in neighborhoods with scores below the 45-degree line, which means that the opportunity scores for Hispanic and Black children are well below the overall opportunity score in their metro.
The chart currently shows inequities between Black and White children. To compare other racial/ethnic groups, select from the pull-down menu. After making your selections, click inside the chart to close the menu.
Where do children live in relation to opportunity?
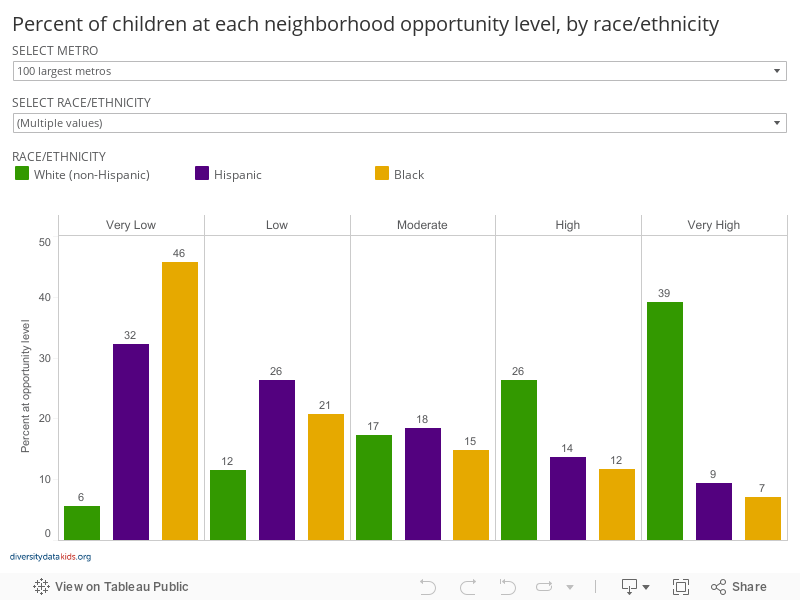
The five Child Opportunity Levels are a helpful tool for summarizing whether all children have equitable access to neighborhood opportunity. By construction, each opportunity level includes about 20% of the U.S. child population. However, when we examine access to opportunity by race/ethnicity, we do not see an even distribution of children across the five levels. White and Asian children are highly concentrated in high- and very high-opportunity neighborhoods, while Black and Hispanic children are highly concentrated in very low- and low- opportunity neighborhoods. This inequity pattern is pervasive across the country but some metro areas show even more extreme inequities.
Use the tool below to see where children live across the five levels of neighborhood opportunity in a given metro area. After making your selections, click inside the chart to close the menu.
""Few tragedies can be more extensive than the stunting of life, few injustices deeper than the denial of an opportunity to strive or even to hope, by a limit imposed from without, but falsely identified as lying within.”"
Source: Child Opportunity Index 2.0 database, diversitydatakids.org.
Note: A data revision in June, 2020 has led to very small changes in datapoints/rankings for some individual metros. See the revisions and updates page for complete details.