The Boston area is home to our project diversitydatakids.org and the Child Opportunity Index. Like many communities, Boston has a painful history of racism and discrimination, which continue in many forms to this day. To illustrate the ways in which our redlining data can be used to understand the legacy of racist policies, we offer a case study of redlining and contemporary neighborhood opportunity in Boston.
Historical redlining patterns in the Boston area
Residential Security maps of the Boston area, created by the Home Owners Loan Corporation (HOLC) in 1938 for assessing risk of mortgage refinancing, reflected the racist attitudes of that time. These views and practices privileged the area’s outlying suburban communities, which were populated by White and U.S.-born residents, and stigmatized communities with Black and foreign-born residents. HOLC’s color coded maps categorized neighborhoods into four grades, ranging from green (A, or “best”) to red (D, or “hazardous”). These maps, which were intended to indicate the risk of mortgage loans, reflected not only the economic, housing and environmental conditions of neighborhoods, but also prejudiced assumptions about their worth based on the race/ethnicity, religion and immigrant status of their residents.
While not deterministic, neighborhoods’ HOLC grades are strongly associated with a range of contemporary neighborhood characteristics, including opportunities for child health and wellbeing, life expectancy, homeownership, school poverty and racial/ethnic composition, with redlined neighborhoods being distinctly disadvantaged. Over time, some redlined areas in the Boston area have gentrified, perhaps due to prior lack of investment that depressed property values, which made them ripe for later acquisition and redevelopment. However, these changes have not benefited all families. The small number of formerly redlined neighborhoods in the Boston area that have transitioned to higher-opportunity status have majority White child populations today—while those formerly redlined neighborhoods that continue to offer lower opportunities today are predominantly Black or Hispanic.
Characteristics of the Boston area’s redlined neighborhoods
The original HOLC Residential Security maps for the Boston area included the city of Boston as well as a number of adjacent and nearby communities (Figure 1). Redlined areas were concentrated in certain neighborhoods of Boston: Roxbury, the South, North and West Ends, East Boston, Charlestown, and parts of South Boston and Dorchester. Other redlined areas included eastern portions of Cambridge and Somerville and sections of Revere, Chelsea, Everett and Malden. The highest graded areas, marked in green and blue, tended to be in the town of Brookline and outer suburbs, while yellow (C, or “definitely declining”) coded neighborhoods were scattered throughout the area. Not all parts of the Boston area received a HOLC grade; similar to other HOLC-mapped communities, areas farther from the urban core were less likely to be graded. Still, valuable insights can be gleaned from analysis of Boston area neighborhoods that received a HOLC grade.
Figure 1. Boston Area Redlining Map (Sections 1 and 2 combined), 1938
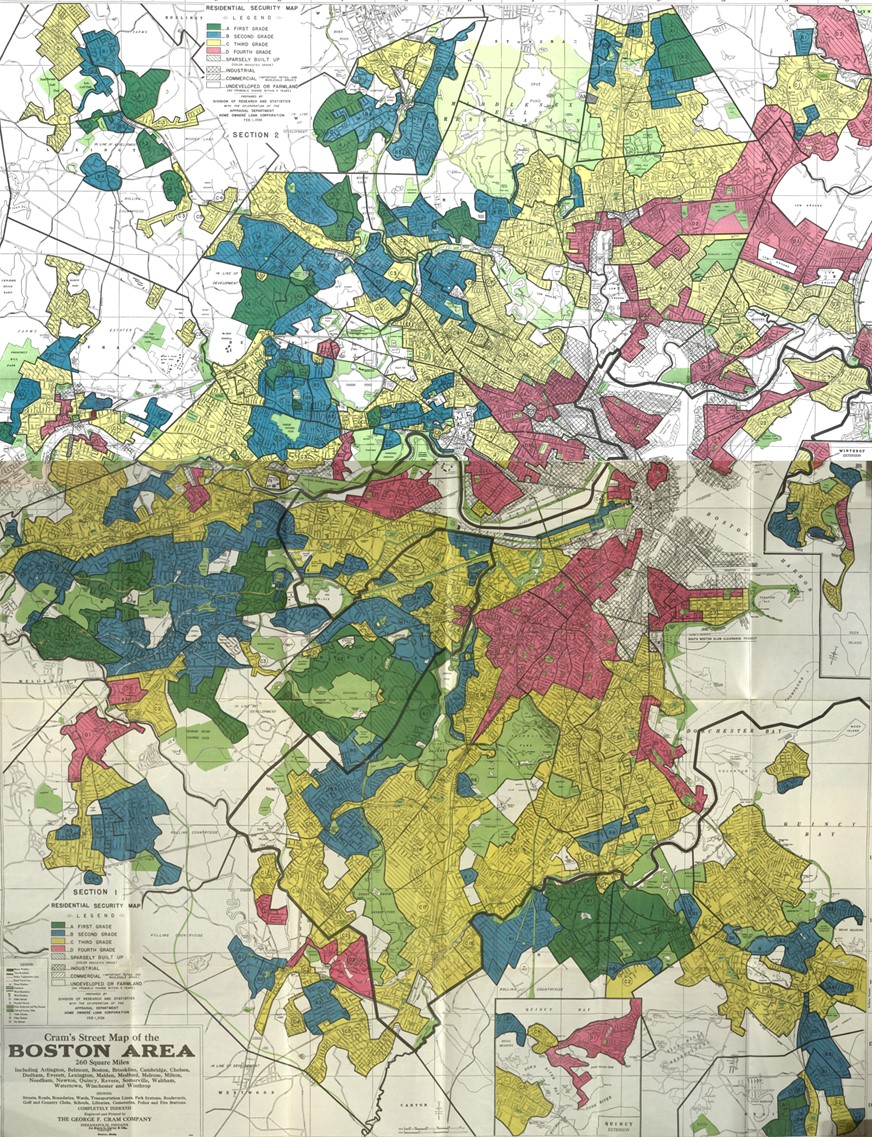
Image Source: Robert K. Nelson, LaDale Winling, Richard Marciano, Nathan Connolly, et al., “Mapping Inequality,” American Panorama, ed. Robert K. Nelson and Edward L. Ayers, accessed October 30, 2023, https://dsl.richmond.edu/panorama/redlining/#loc=12/42.411/-71.068&text=downloads&adimage=2/40/-152.903
Area descriptions, produced in conjunction with the HOLC maps, used offensive, blatantly racist, classist, antisemitic and xenophobic language to describe neighborhood residents. The assessments asserted that the presence of Black residents had clear negative impacts on the neighborhood, virtually assuring a “D” (or at best a “C”) grade. Standardized forms used in making HOLC’s assessments included sections for specifying the presence and percentage of “Negros.” For example, one redlined area of Roxbury that was identified as 25% Negro included the clarifying comment “Negro heavily concentrated north of Ruggles St.” Assessment of a “C” rated neighborhood in Cambridge noted, “A few negro families have moved in on Dame St. and threaten to spread.” (At the time, the city of Boston had a relatively small Black population (3%) that was a very small fraction of Chicago’s and New York’s.) Redlined areas also described in offensive and negative terms the presence of foreign-born residents, particularly Italian, but also Irish, Syrian, Canadian and Lithuanian. Higher graded areas warned of “foreign infiltration.” Finally, antisemitism was present in the HOLC assessments, with the presence of Jewish residents and a “cosmopolitan population” noted as negative elements.
Socioeconomic and physical neighborhood characteristics also played a large role in HOLC ratings. Assessments noted the number of “relief families” who received federal income assistance, occupational and income levels and information on housing quality, traffic, congestion, obsolescence and pollution. For example, in one highly rated, low-risk neighborhood of Brookline, HOLC assessments noted in positive terms an “infiltration” of “high class” professional men; no Black, foreign-born or relief families; and rolling terrain and custom-built houses “restricted to singles.”
Relationship between neighborhood HOLC ratings and child opportunity
Clear associations exist between historic HOLC ratings and current neighborhood characteristics, although the relationships are not necessarily causal. One such relationship is between HOLC ratings and a measure of contemporary child neighborhood opportunity, the Child Opportunity Index 2.0 (COI). The COI combines neighborhood-level indicators related to child well-being, such as quality schools and housing, clean air, access to green spaces and economic prospects, into a single composite measure for each census tract in the U.S. Unlike HOLC grades, the COI is “race-neutral”; it does not consider the racial/ethnic composition of the neighborhood in its scoring. Nevertheless, our analyses have found that across the 100 largest metropolitan areas in the U.S., Black children are 7.6 times and Hispanic children 5.3 times more likely to live in very low-opportunity neighborhoods than are White children.
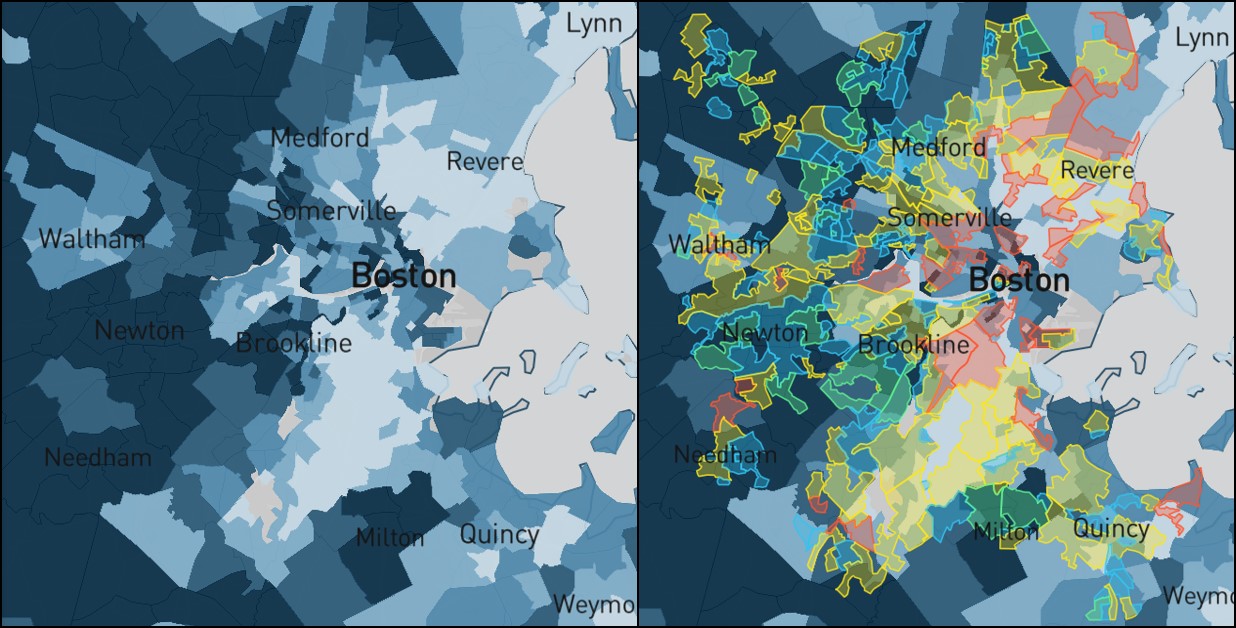
The left-hand panel of Figure 2 presents a map of the COI across the Boston area. The map shows neighborhoods (defined as census tracts) categorized into five opportunity levels, ranging from very low-opportunity (light blue) to very high-opportunity (dark blue). These opportunity levels are defined relative to all tracts in the Boston metro area, which includes the surrounding cities and parts of southern New Hampshire. The lowest opportunity neighborhoods are clustered in the Roxbury and Dorchester neighborhoods of Boston (south and west of downtown) and in East Boston, Chelsea, Everett and sections of Revere. The highest opportunity areas are located in central Boston neighborhoods including Beacon Hill, Back Bay, parts of the South End and the North End, portions of Cambridge and Somerville and the towns of Brookline, Milton and the western suburbs.
The right-hand panel of Figure 2 overlays HOLC’s redlining maps onto the COI. Most of the highest HOLC graded areas (green and blue outlines) correspond to today’s higher opportunity neighborhoods (darker blue shaded areas), while most of the lowest HOLC graded areas (red and yellow outlines) correspond to lower opportunity neighborhoods (lighter blue shaded areas), although these correspondences are not exact.
Figure 2. The Child Opportunity Index (left) overlaid with HOLC neighborhood ratings (right)
Connecting redlining to contemporary health and opportunity
Understanding the connections between past racist policies, such as redlining, and child neighborhood opportunity today is critical to determining how to create a more equitable future. Today’s census tracts, however, often overlap multiple HOLC-rated neighborhoods, sometimes with different grades. To facilitate equity analyses, our redlining mapping application overlays historic HOLC area boundaries on top of the COI’s census tract boundaries, displaying how they overlap as well as the proportion of each current tract area that was originally rated “A”, “B”, “C” or “D” by HOLC. diversitydatakids.org has also developed a novel method of classifying present-day neighborhoods according to their HOLC grades and created classification typologies, available for public use. These typologies range from a simple four grade classification (“Mainly A,” “Mainly D,” etc.) to more complicated but predictively optimal classifications. Our analysis presented here uses the simple four class typology and includes census tracts in the Boston area for which at least 5% of the land area was graded by HOLC.
With these new classes, we can see the extent to which historical HOLC ratings are associated with contemporary child opportunity, as well as long-term health outcomes like life expectancy. Figure 3 shows, for children today living in neighborhoods of each HOLC-based class (“Mainly A” through “Mainly D”), the percent who live in neighborhoods of each Child Opportunity Index level. This information illustrates, for example, the extent to which historically redlined neighborhoods now offer relatively fewer opportunities for child health and wellbeing than areas that were “greenlined.”
We find that 79% of Boston area children today living in “Mainly A” neighborhoods live in very high-opportunity neighborhoods, according to the COI. No children in the “Mainly A” class neighborhoods live in low or very low-opportunity neighborhoods, reflecting the ability of those neighborhoods to hold onto resources over the century. At the same time, 84% of children in the lowest HOLC-based class neighborhoods (“Mainly D”) live in very low- or low-opportunity neighborhoods. And, only 6% of those living in “Mainly D” neighborhoods live in very high-opportunity neighborhoods, reflecting continued deprivation in these areas.
There are also strong associations between HOLC-based neighborhood classes and a variety of other neighborhood characteristics (Figure 4). Sadly, we find that the median life expectancy today in “Mainly D” neighborhoods is over 5 years shorter than in “Mainly A” neighborhoods. School poverty rates in “Mainly D” neighborhoods are also almost 10 times those in “Mainly A” neighborhoods, and homeownership rates and the percent of adults with a bachelor’s degree or higher are both much higher in neighborhoods with better HOLC-based classes.
Racial/Ethnic composition of neighborhoods by HOLC classification
There is a striking relationship between historic HOLC grades and the Boston area’s contemporary neighborhood racial/ethnic composition. Even though original HOLC grades were based in part on the presence of Black residents, Black children today living in census tracts classified as “Mainly D” are only slightly disproportionately represented compared to the Boston area (Figure 5). The child population across all HOLC rated tracts in the Boston area is 19% Black; “Mainly D” class tracts are 21% Black. However, HOLC grades are now associated with racial/ethnic makeup for other groups. We find that “Mainly D” class tracts are much more disproportionately Hispanic (39% compared to 23% for all Boston area HOLC rated tracts), and much less non-Hispanic White (30% compared to 44% for all Boston area tracts). In contrast, “Mainly A” class tracts are disproportionally more White (71%) and much less Black and Hispanic (5-6%) than the distribution of these racial/ethnic groups across all Boston area HOLC rated tracts.
Who Benefits from Gentrifying Neighborhoods?
Although the vast majority of those children in tracts classified as “Mainly D” live in low- or very low- opportunity neighborhoods (Figure 3), that relationship is not absolute. There is a small percentage (8%) of children living in historically “Mainly D” tracts that are now categorized as providing high- or very high-opportunity. Who are these children living in formerly redlined areas that are now considered to support healthy child development? Over two-thirds (69%) of such children are non-Hispanic White (Figure 6). In contrast, of children in formerly redlined (“Mainly D”) tracts that remain of low- or very low-opportunity, over three-fourths (76%) are minority, mostly Hispanic or Black. Therefore, we find that although the association between redlining and current day child opportunity is not fixed, in the Boston area the benefits of neighborhood change appear to be disproportionately enjoyed by White children.
Moving toward equity
The racial/ethnic segregation and inequities in access to neighborhood opportunity associated with redlining and other discriminatory practices are deeply inscribed in the geography of the Boston area, and they are perpetuated by continuing practices such as exclusionary zoning. Our newly available map application overlaying HOLC ratings on contemporary Child Opportunity Index levels as well as our innovative typologies reconciling HOLC area and census tract boundaries allow for in-depth exploration of the relationships between HOLC ratings and child neighborhood opportunity. It is our hope that these publicly available resources will lead to greater understanding of the long-term differential effects of HOLC ratings, be it redlining or greenlining, and spur efforts to rectify these inequities. The children of the Boston area, as well as those throughout the nation, deserve nothing less.
***
Cover image citation: Robert K. Nelson, LaDale Winling, Richard Marciano, Nathan Connolly, et al., “Mapping Inequality,” American Panorama, ed. Robert K. Nelson and Edward L. Ayers, accessed October 30, 2023, https://dsl.richmond.edu/panorama/redlining/#loc=12/42.411/-71.068&text=downloads&adimage=2/40/-152.903.
Learn more about our project From Redlining to Child Opportunity: Confronting systemic racist residential segregation